README
Landsat LST P95 composites (2021–2025)
This repository contains processing code and metadata for scene-normalized 95th-percentile land surface temperature composites derived from Landsat 8/9 observations from 2021–2025 and published on Source Cooperative. The composites show persistent spatial patterns in extreme surface heat while reducing artifacts caused by scene-level atmospheric differences and Landsat's orbital sampling geometry. Values are expressed in degrees Celsius but should not be interpreted as the unmodified 95th percentile of observed temperatures.
Philosophy
The goal of publishing this dataset is to make high-resolution data about extreme surface heat widely accessible as a decision-support tool. While land surface temperature (LST) is not a perfect measure of the human experience of heat, these data are intended for use in communities that otherwise would be unlikely to ever have access to any data on heat.
Many of the communities most exposed to extreme heat don't have access to local data and don't have the capacity or resources to pursue sophisticated modeling efforts (e.g., SOLWEIG) on their own. And because efforts on developing open-source heat-risk datasets tend to focus on larger, high-impact locations (e.g., the US, Delhi, Mexico City, Nairobi), smaller cities could be left waiting indefinitely for "better" open-source datasets to become available in their region.
LST is freely available, globally consistent, and scientifically well-understood. It can reveal spatial patterns in how landscapes absorb and retain heat and, while imperfect, it is adequate for informing a number of urban planning applications, such as prioritizing neighborhoods for tree-planting campaigns or understanding the relationship between land cover and extreme heat. Accordingly, this dataset is intended as a practical decision-support resource, rather than a definitive scientific measure of heat. It's meant to be interpreted alongside datasets like tree canopy height, building footprints, building heights, and land cover, which, in combination, can help explain why some places are consistently hotter than others and where interventions might be most effective.
This dataset is explicitly meant as a kind of v0.1. We have prioritized simple, transparent methods over more complex approaches, even when that means, e.g., leaving some coverage gaps in the data. Our feeling is that, rather than waiting for ideal data products that may not become available globally for years, there is substantial value in providing an open-source, fit-for-purpose dataset today, together with clear guidance on appropriate use, limitations, and interpretation. Ideally, though, we would like to see funders and researchers render this dataset obsolete by producing better globally available, high-resolution datasets on extreme heat.
If data availability is not a concern for you, and you are looking for the most scientifically precise representation of the human experience of heat, we recommend considering other heat datasets. Likewise, if you are concerned with Landsat's exact LST values and you have the capacity to compute them yourself for your area of interest, we recommend doing so yourself (you might follow this tutorial from USGS). This dataset is specifically meant for people who are in data-scarce regions and would not otherwise have the capacity to assess extremes in relative surface temperature.
Data processing, storage, and access
Processing
This dataset contains a five-year composite of 95th percentile land surface temperature values from Landsat 8/9 from 2021 through 2025. The choice of this metric was influenced by WRI's excellent work at the Cool Cities Lab. The data are global, excluding areas north and south of 60° latitude, which are basically unpopulated and would have increased processing and storage fees for minimal benefit. We've used standard QA masking (e.g., excluding clouds, cloud shadows, snow, ice), and also masked out pixels over water. In a handful of cases, we also filtered out physically implausible LST values (e.g., over 80°C, higher than the highest recorded LST temperature). Note that all of these are represented as nodata in the LST COG.
There are also notable gaps in some regions due to either known gaps in the ASTER coverage used by the USGS to produce LST estimates or, in some cases (mostly in the tropics), persistent cloud cover making it impossible to get reliable observations. We have not gap-filled these instances. (See known issues for more.)
We require at least five valid observations across the full 2021–2025 period for a pixel to receive an LST value. Pixels with fewer observations are reported as nodata. Because five observations is a permissive minimum, P95 values near this threshold are sensitive to individual observations. Users should consult the 12-band qa_count asset when assessing reliability, particularly in persistently cloudy regions.
The only modifications we made to the data were for the purposes of scene normalization and de-striping. We consider it very important that less technical users are presented with a product that looks visually plausible and is not covered in large, obvious jumps in temperature from one pixel to the next along, e.g., Landsat swaths. We found that this striping stemmed from two sources: atmospheric correction to Landsat scenes and overlapping swath boundaries producing more observations in some areas than others. To handle these, we applied two techniques.
Scene normalization
LST can shift from scene to scene because Landsat's atmospheric correction is not perfectly consistent. These shifts can make the surface appear artificially warmer or colder even when the underlying temperature pattern has not changed, and produce notable striping in the resulting image. We estimate and normalize this scene-level bias by comparing each valid pixel in a scene with that pixel's median temperature for the same calendar month across the five-year record. We take the scene-level median of those pixel-level differences to get a single offset, which we then subtract from every valid pixel in the scene. Because the same correction is applied across the scene, it changes individual, pixel-level LST values but preserves relative spatial differences within the scene.
Feathering
Pixels where Landsat orbital paths overlap have many more observations than pixels covered by only one path. Those extra observations can be meaningfully hotter or colder than the surrounding areas, which can appear as visible stripes. We address this by calculating P95 separately for each WRS path. Then, where paths overlap, we blend the two results together, weighted by distance from each path edge, so that pixels closer to the edge get less weight. This produces a smooth transition between the two path estimates. It changes values in overlap areas, but does not smooth variation within either path. This follows the core aim of the product: to show relative surface heat as clearly as possible, with artifacts from Landsat's sampling geometry minimized, so that the resulting patterns are useful for planning and decision-making.
Storage and access
Data are stored as Cloud-Optimized GeoTIFFs in a Portolan catalog on Source Cooperative. Each STAC item contains two COG assets, spanning 5° in EPSG:4326:
The data can be opened normally with, e.g., rasterio, pystac, QGIS, etc. You can, for example, use the STAC item to resolve the COG URL, then read only the area you need with rasterio.
Known issues
ASTER coverage gaps
There are sizable, documented gaps in the ASTER Global Emissivity Dataset (GED), stemming from persistent cloud cover, which affect our end product.
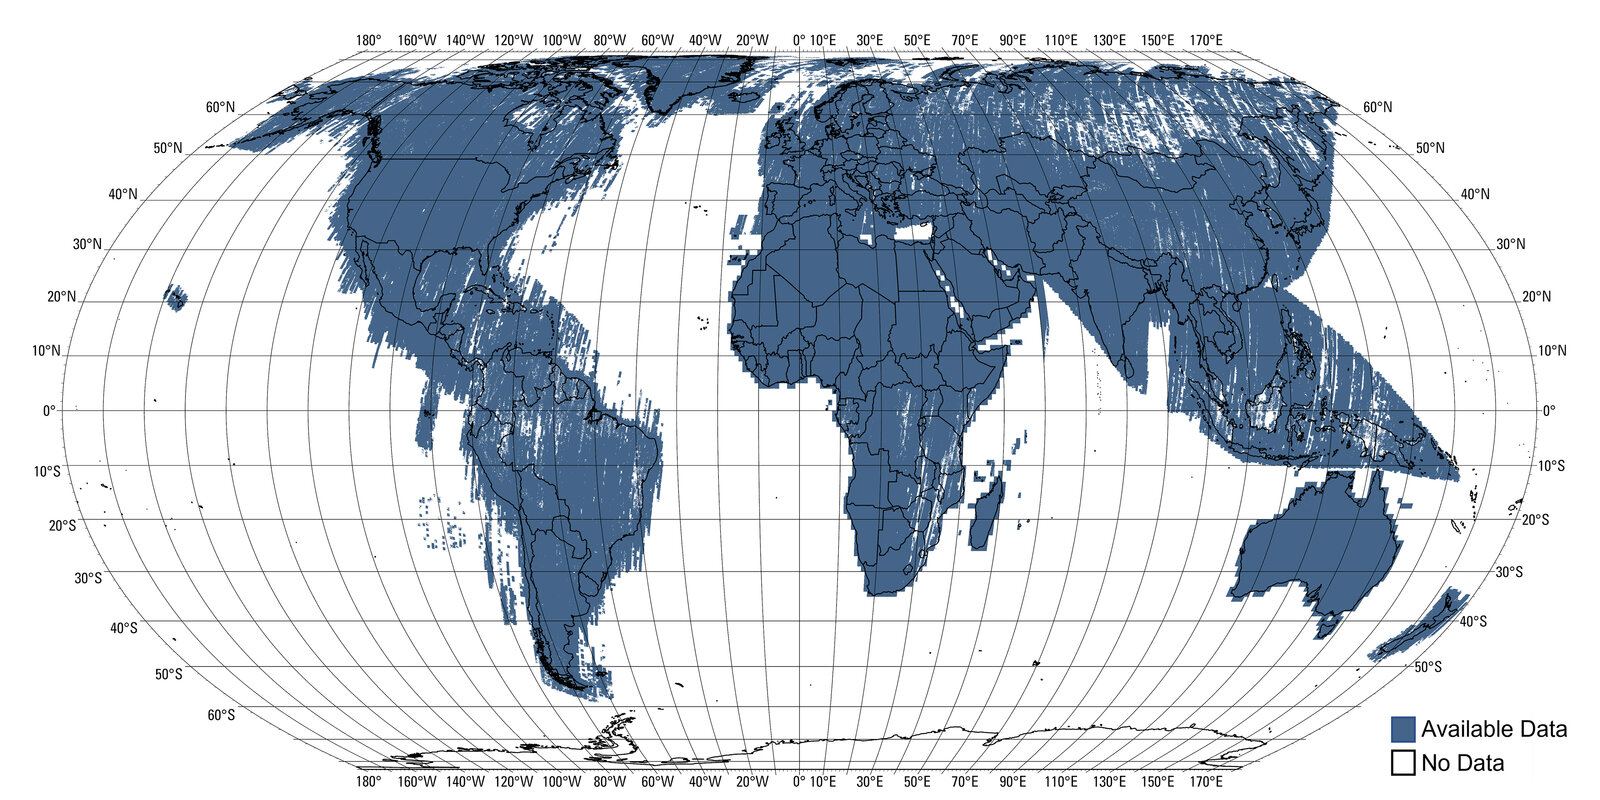
Via USGS.
We compared these gaps to GHS-SMOD R2023A urban land and found that they impact 2.66% of urban land. Another 10.23% of urban land rests on only one or two ASTER observations. Here is a breakdown by region:
Where coverage was missing due to ASTER GED gaps, we report nodata.
Limited tropical coverage
We have also observed patches with missing coverage in, e.g., the Brazilian Amazon, which appear to be the result of persistent cloud cover. We haven't quantified the total area impacted by these gaps, but it is primarily in tropical, sparsely populated regions.
Intended use
These data should be used for mapping relative differences in land surface temperature and identifying heat-mitigating and heat-promoting surfaces. This is meant as a decision-support tool to understand relative heat impacts, not a precise scientific measurement of the human experience of heat. Users are encouraged to read the USGS's documentation on Landsat 8/9's surface temperature data and the World Resources Institute's, and to seek technical support from experts in, e.g., local universities in interpreting and applying the data.
Ancillary data
Land surface temperature is best understood in the context of ancillary data on factors like building location and volume, tree canopy cover, distance to water bodies, and land cover. When good local data on these are unavailable, we recommend the following:
- Built-up volume from the Global Human Settlement Layer.
- Global building heights from the GlobalBuildingAtlas.
- Overture Maps building footprints.
- Tree canopy height from World Resources Institute and Meta.
- ASTER Global Water Bodies Database from NASA.
Example notebook
A notebook for this data product is planned. In the meantime, this cookbook on Pergamino, Argentina shows the approach we encourage: pulling in ancillary datasets such as global tree canopy cover and building heights, and assessing them holistically with an eye toward concrete planning interventions.
Development
See AGENTS.md.
Provenance
The USGS produces the Landsat Collection 2 Level-2 surface temperature scenes that these composites read, and distributes them through LandsatLook. The compositing is ours: every numeric rule, and every run that wrote a tile, lives in landsat-lst-smoke. Source Cooperative hosts the published result. Each item's processing:lineage records the rules that produced its pixels and names every input artifact by checksum, so a tile can be traced back to the scenes and the ancillary rasters it was built from.
License
This codebase carries an Apache 2.0 license. The data themselves are available under CC0-1.0, based on USGS terms for Landsat Collection 2 products.